Year-end offer: Save 50% on Able2Extract Professional single license purchases before December 31!

How to Password Protect a PDF (Step-By-Step Guide for 2016)

Right now, there are more than 2.4 billion PDF documents roaming the world wide web.

This means that we are slowly, but surely heading towards a major digital milestone– one PDF per person. However, as  the PDF gets closer and closer to this superstardom status, it means we need to take our document security seriously and take charge of who gets to see our information.

When you password protect a PDF, you are in full control. You are the puppet master of that document and you decide who gets permission to view, edit and manipulate your work. Do not mistake that with being selfish.

There is a justified reason why people of all professions should consider encrypting PDF documents when transferring important files.

For example, an accountant may often correspond with his or her clients via email. If there’s an unprotected report in that communication, and it contains particularly sensitive information then it’s at huge risk of being stolen or misplaced. And that’s why it’s always smart to password protect your PDF.

The big question is: how do we go about it?

Well, it all comes down to your workflow. We brainstormed some common scenarios when you’d want to perform this particular task:

  • You want create a password protected PDF from other file formats
  • You have a ready PDF that you just need to encrypt and save

Let’s go to work.

Creating Encrypted PDFs From Other File Formats

We’re starting with the most common way of encrypting PDF files and we’re going to walk you through two options:

  • Create an encrypted PDF straight from MS Office (does not work with MS Excel)
  • Create an encrypted PDF document using a PDF creation software (works with all file formats)

Creating Encrypted PDF Straight From MS Office

If you need to password protect an Excel document while printing it to PDF, then go to the next chapter where we discuss that particular task.

If you would like to print a Word document to PDF and add password protection, then just follow the steps below:

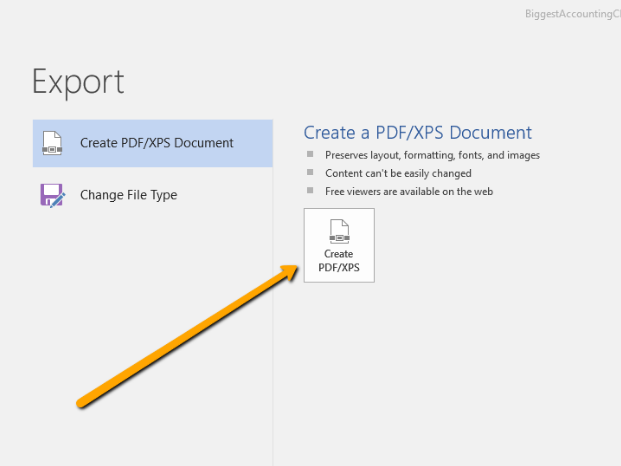
1) Go to File > Export
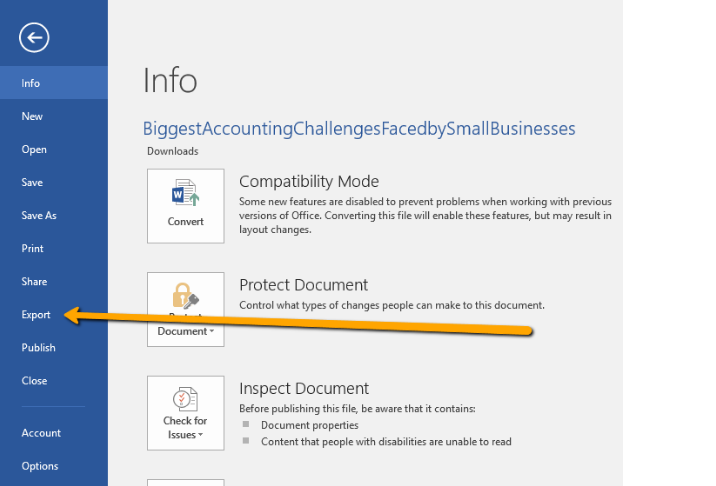
Exporting PDF MS Word

2) Create PDF/XPS document

Create PDF In MS Word

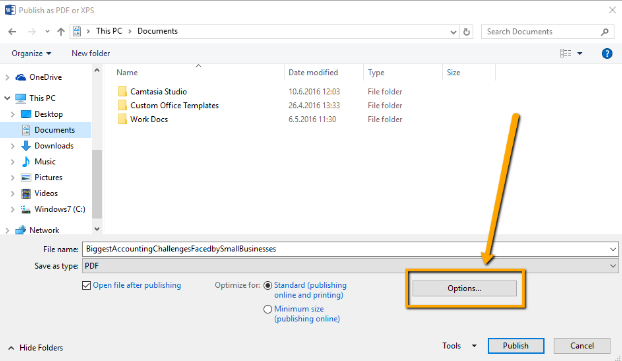
3) Click on Options

PDF Creation Options In MS Word

4)  Check “Encrypt the document with a password”
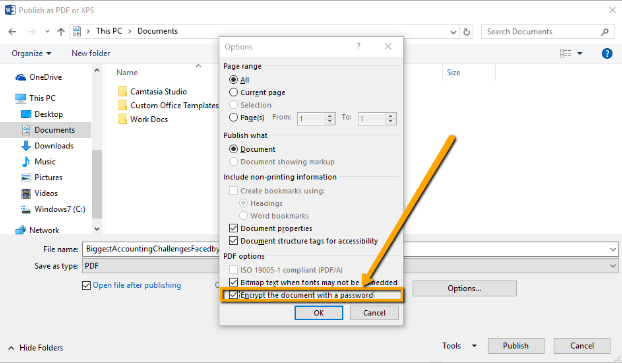
MS Password Encryption Option

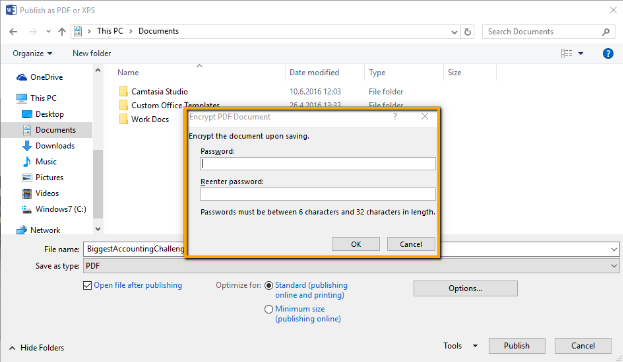
5) Enter the password and hit OK

Encrypting PDFs In MS Word

Job done. You‘ve now successfully created a password protected PDF out of MS Word. But what about other file formats?

Creating Encrypted PDF Documents Using PDF Creation Software

You can use a variety of PDF creation software to print an encrypted PDF document from other applications. For this tutorial we are going to use our very own Able2Extract. You can download the free trial and follow along:

1) Open Able2Extract and go to View >PDF Creation Options
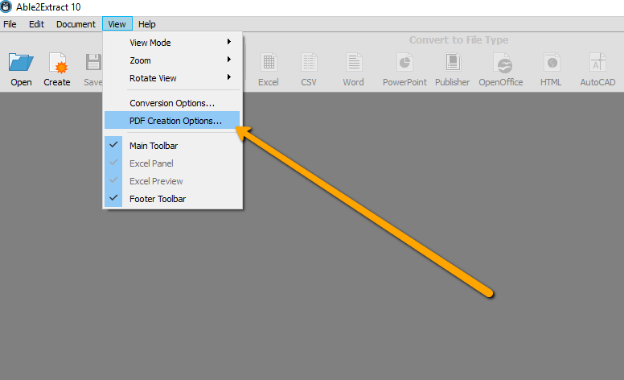
Accessing Able2Extract PDF Creation Options

2) Security > Check the Secure PDF and enter the User and Owner names. The  User field will be your password. Set up the desired permissions and click OK.
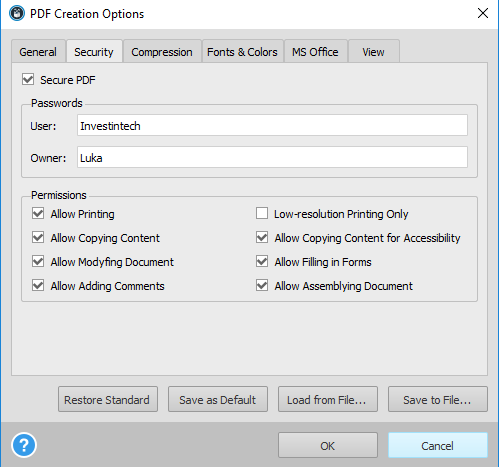
PDF Security Dialog

3) Go to Create PDF > open your file (you can create PDF out of all printable formats)

Selecting Able2Extract Create PDF Icon

4) The tool will print your file to PDF and automatically apply the security settings you just added.
Able2Extract PDF Creation Progress Bar

The only thing remaining is to save it back to PDF and you’re done. Everything clear? Let’s move on to the next part.

Adding Password to an Existing PDF

You can add a password to an existing PDF in a variety of ways, but the main choice you will have to make is whether you’re going to do it on your desktop or online.

I would suggest sticking to your desktop when working with bigger documents and possibly using an online tool if you’re handling a PDF with a smaller file size.

However, there’s no escaping the fact that, whatever the size of your PDF file, you may be thinking of encrypting it. This further implies that document security is your utmost priority, which means that you should probably stick with a desktop tool. If you have already downloaded Able2Extract then this will also be a walk in the park.

1) Open your unencrypted PDF in Able2Extract, select all and convert it to its corresponding format. If it’s a PDF with textual  content  then convert it to Word, if not you can choose between the other file formats available.
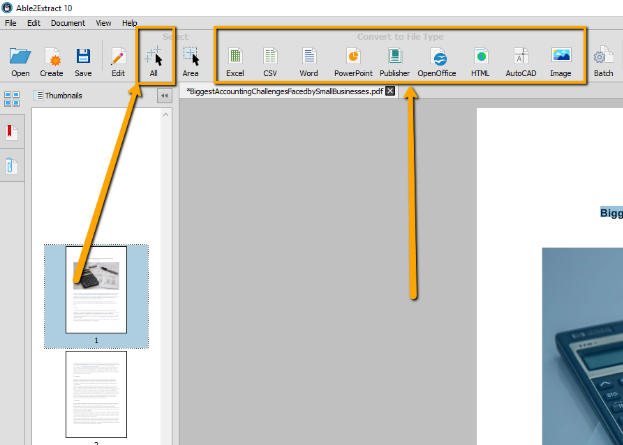
Selecting Able2Extract Conversion Selection Options

2) Your converted file will automatically open. Now, just follow the steps below to apply password protection from your MS Office application:

a) Go to File > Export

b) Create PDF > Options > Encrypt the Document

Once again, if you’re trying to create a PDF from Excel and add a password to it,  know that it can’t be done in this way — go back to the part where we explain how to create a password protected PDF using software.

BONUS: How to Add Password to a Scanned PDF File

Once in awhile, we may come across with a scanned PDF document. What makes scanned PDFs so difficult to work with is that they are essentially images with a .pdf extension, so they can’t be rendered by your regular file editing application.

What we can do in such instances is use Able2Extract Professional, which has integrated OCR (Optical Character Recognition) technology. To apply password protection on a scanned PDF:

  1. Open the PDF in Able2Extract Professional
  2. Convert the scanned document to your file format of choice
  3. Apply the password protection steps from the tutorials above

So, there you go guys, some actionable tips on how to secure your document and ensure that your work is traveling safely.

Did this tutorial help you? Share it and spread the love. Leave your questions in the comments below.


How To Create A PDF Portfolio From Your Instagram Photos

Viewing Instagram On Laptop

Instagram selfies are all the rage these days. The app has helped users (and celebrities) produce some of the most widely shared pictures on the web.

Who doesn’t like to take a fun pic when they’re out and about or when a memorable family moment crops up?

Yet for some, Instagram is a professional tool. From graphic designers and photographers to online entrepreneurs and real estate agents, Instagram is an extremely effective platform for marketing and spreading the word visually about what they have to offer.

Whether you have photos of your workspace, products or digital work, a PDF portfolio of your best Instagram shots is a super easy way to enhance your professional pitch and drum up some business. Here’s how.

1. Download Instagram Photos With DInstagram

The first thing to do is download your Instagram photos. DInstagram is a Chrome extension that allows you to download individual Instagram photos.  To do this:

a) Install the extension on Chrome.

b) Log into your Instagram account (this will also work if you aren’t logged in and are viewing your account’s photos, too).

c) Click on the photo you want to download.

d) In the upper right hand corner, click on the DInstagram Select your format (choose either PNG or JPG). Select the image size (Big, Medium, Small). Click on Download.

Downloading Instagram Image

e) Save the photos onto your computer. Tip: create a new single folder for all your photos for easy access.

2. Convert Your Instagram Photos To PDF

The next step is actually getting those photos into the PDF format. This is where Able2Extract 10 comes in handy.

a) Open Able2Extract 10.

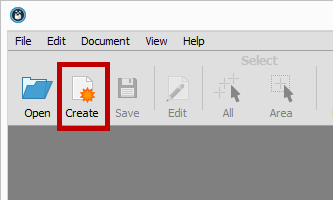
b) Click on the Create icon in the toolbar.

Creating PDF In Able2Extract

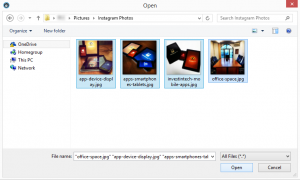
c) Select your image files. Able2Extract 10 will let you quickly open a number of images simultaneously just by selecting multiple files at once. Click on Open.

Opening Images In Able2Extract

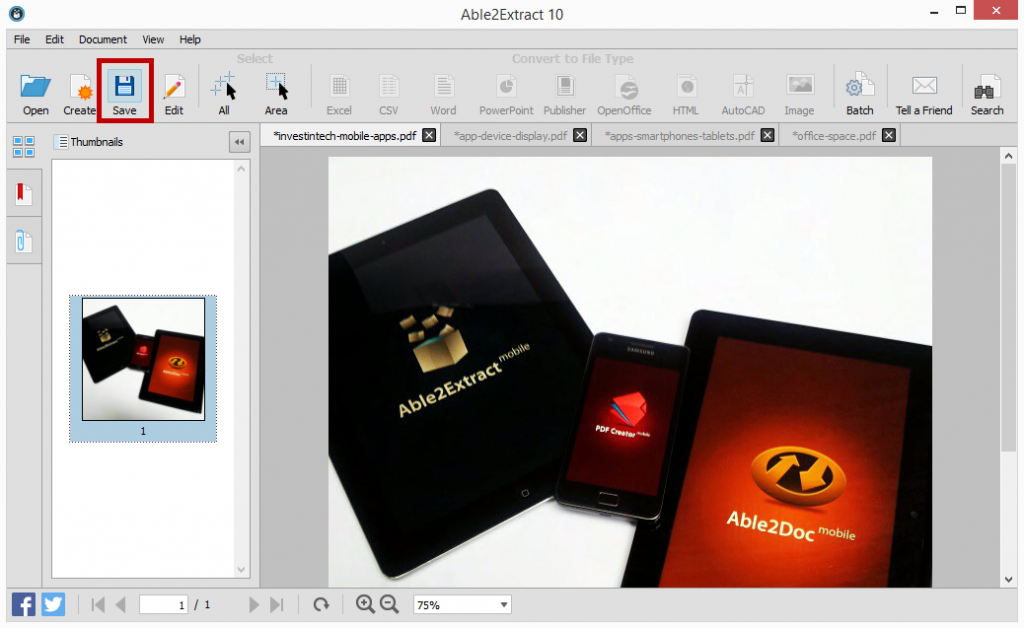
d) In each tab, click on Save.

Saving Images As PDF

Tip: Just as you did previously, create a new folder for all the PDFs you will be creating. This will give you a place to export any other future Instagram shots in PDF you may want to include when you update your portfolio.

3. Merge Your PDFs Into One

Now that you have all your image files saved as a PDF, you can start putting them together into one PDF file. You can continue on from Able2Extract. No need to exit the application. You can close off all but one of the tabs.

In that one tab you have left opened,

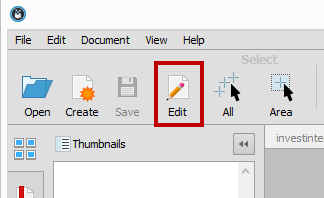
a) Click on the Edit icon from the toolbar. This is the file from which you will be creating your PDF portfolio. You can rename the file later on as needed; no need to worry about that just yet.

Editing PDFs In Able2Extract

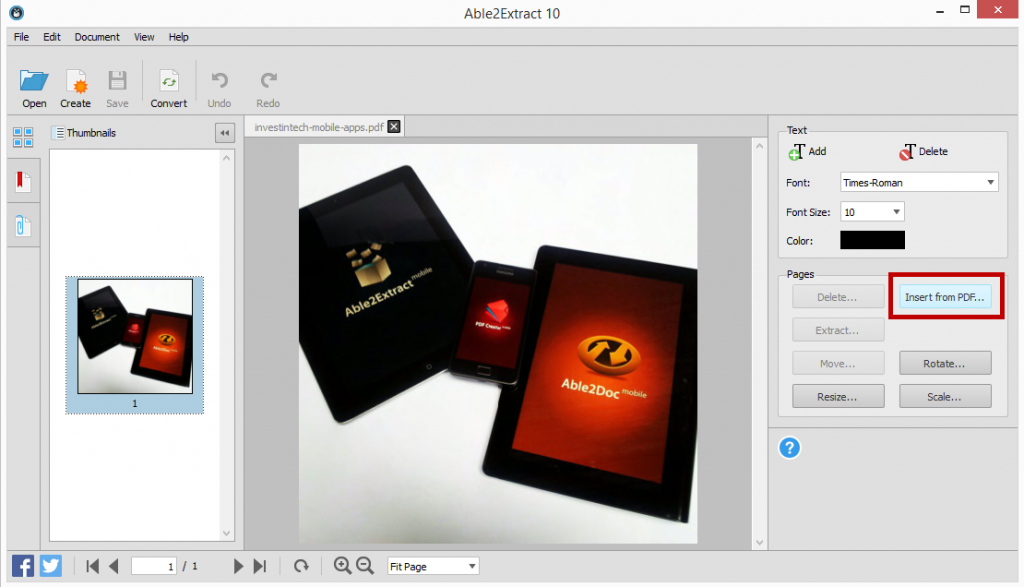
b) Click on the Insert from PDF… option in the Editing panel. One by one, you can add your newly created PDFs to the file by selecting it and clicking on Open.

Inserting Pages Into PDF

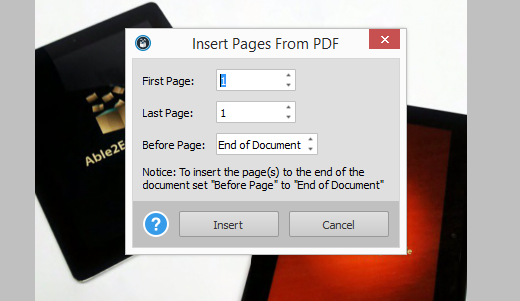
In the pop up dialog, leave the value in both page fields to 1 (it will be the first and last page you insert). You can decide the order of your images by using the Before Page field:

Merging PDF Pages Together

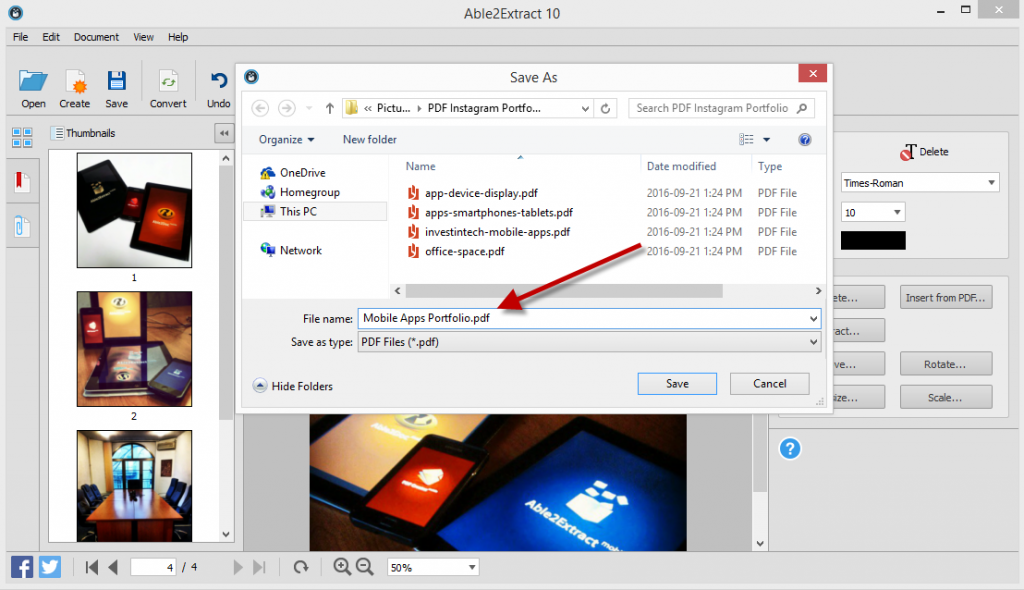
c) Once all your PDF photos are inserted, click on the Save icon once again. Or as mentioned above, you can rename the file by going to File > Save As… and renaming your file.

Renaming PDF In Able2Extract

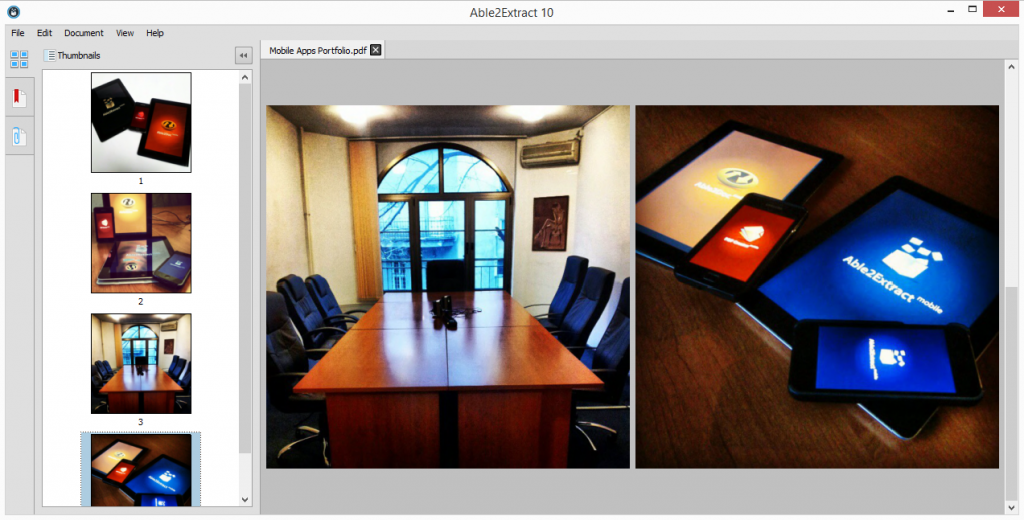
The final result? A professional looking PDF portfolio made from some of your best images:

Viewing PDF Portfolio In Able2Extract

You can repeat the above steps in this third section to get other PDF content into the portfolio for a complete look. Add a title page, PDF pages with company information, a section on your services, testimonials from clients or even add a page with a list of publications that have featured your products.

How effective your portfolio becomes is up to you, so show off your best stuff!

How To Remove/Purge Unused CAD Blocks?

Part 11 of 13 in our How To Use AutoCAD series

While working on our designs, we may find ourselves in a situation where we create blocks that we don’t end up using.  That’s why it’s beneficial to clean up the drawing and remove unused blocks, layers, shapes, linetypes and other objects.

This can be efficiently done using the “Purge” command, which identifies and removes the unused items.

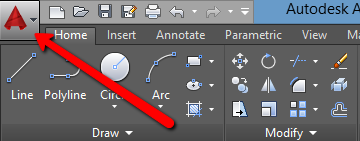
1.To access the “Purge” command, click on the application button, on the top left corner of the AutoCAD window. Then go to “Drawing Utilities” > “Purge”.

AutoCAD Application Button

2.You’ll be presented with a pop up. Leave the “View items you can purge” checked and from the box below choose items that you would like to remove. The “Purge” command identifies all items not used in the drawing.

3.Click on “Blocks”, and select either “Purge” or “Purge All”.

4.When prompted, choose “Purge this item”.

In certain cases, there may be items nested (located) inside other items. You can easily remove those by checking the “Purge nested items” check box. To further master your drawing output skills, read this tutorial on How to Clean Up Your AutoCAD Drawing.

How To Analyze Open Data With Able2Extract, Power BI And DataHero

There is a general sense of helplessness when it comes to analyzing public data, especially as people think it involves insane amounts of statistical mastery and in-depth knowledge of complicated statistical software.

This is especially nerve wracking for data journalists, who are keen on using data to write stories that can actually influence a certain aspect of our society, such as healthcare or education. Truth be told, analyzing data and storytelling actually go hand in hand.

Since the Open Data initiative started, more and more data sets have seen the light of the day on various data-related portals. The most interesting data sets for journalists are the ones who are publicly available, simply because they are free to use and analyze. Those data sets are available on a variety of online sources, such as: www.data.gov, open.canada.ca, data.gov.uk and many more.

Open data portals contain thousands and thousands of data sets, related to various branches of government: education, business, economy, crime, justice, healthcare and more.

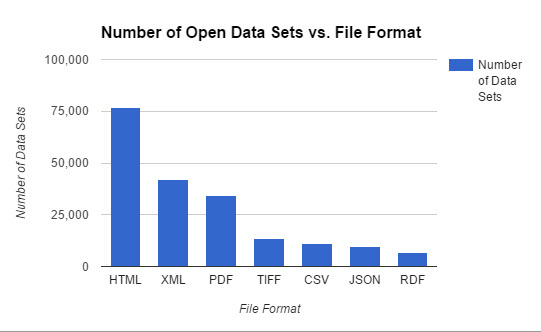
Once you start exploring the online data, you will see that it usually comes in 3 main formats: HTML, XML and PDF.

Common Open Dataset Formats

However, if you start investigating the data sets in more depth, you will quickly notice that there is only one format that’s present in almost every data set — the PDF. So, the logic goes that if you know how to analyze data that’s locked inside a PDF, you’ll know how to analyze any.

But what makes people want to store data in a non editable format?

First of all, when you save a data set as a PDF you are reducing its size, so it’s easier to store and upload to online databases. Secondly, since the PDF is not editable by default, you are making sure that no one tampers with your data and changes any of the ever-so-important numerical values. Remember, people spend countless hours gathering data and they are keen on protecting their hard work as much as possible.

So, once you find a PDF data set, where do you go next?

You now basically have only one option — you need to get that data into an Excel or CSV file format, while preserving source document accuracy as much as possible. After you do that, the next step would be to import that converted file into a data visualization tool of your choice, which we will cover later in this tutorial.

When it comes to exporting PDF data, the only tool in the market that has advanced enough PDF exporting capabilities is Able2Extract. That is because Able2Extract is not just a regular PDF converter. See, most (if not all) PDF converters on the market only convert PDF to Excel automatically, leaving you with a messy data set. The automatic conversion works good for one page invoices but converting a 1,000 page data set takes a lot more than that.

Able2Extract is the only converter that lets you fully customize your conversion by manually setting up row and column structure, prior to conversion. In addition it lets you preview the conversion results from within the software, which lets you export your data set as accurately as possible.

First, find your PDF data set. For this tutorial, we are going to use a practice data set containing all funded projects from Canadian Environmental Damages Fund. You can download it here.

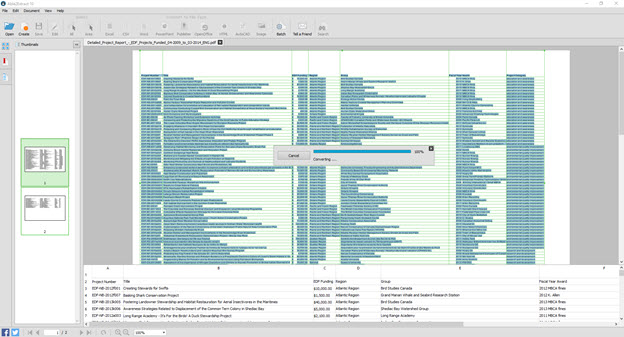
Open the data set in Able2Extract and use custom PDF to Excel conversion to convert it to an Excel file. Set up row and column structure using the right side panel and make sure to check the “Preview conversion” box. Once satisfied, hit the convert button to send the data to Excel.

Able2Extract Custom PDF to Excel

So, we got our data from PDF and into Excel. Great job!  

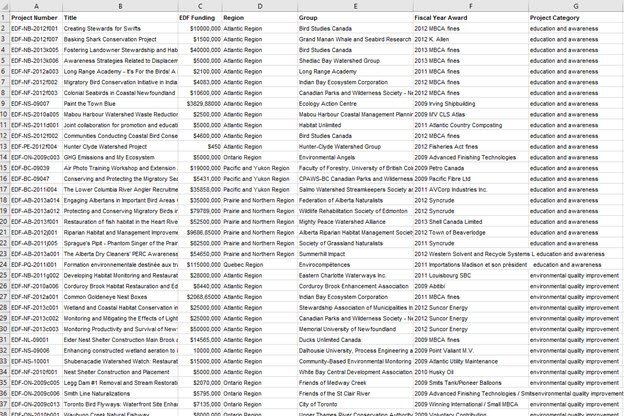
The next step is to go to Excel and clean the data. This will take 15 minutes to 2 hours, depending on the data set, but the thing you are looking for in the end is to end up with data in the tabular format, which means there is a separate row for each record. It should look something like this:

PDF to Excel Conversion Results

Make sure you don’t have any empty rows or blank cells and that all text is formatted in the same way. If there is a row with 3 cells missing it’s best to delete the whole row because it can mess up your end result and produce inaccurate results.

Now that we have a clean and tidy data set, it’s time to give life to these numbers and visualize them. Enter data visualization.

Data visualization simply means to create interesting charts from just plain data, which makes it easier to understand and present to your readers. When it comes to visualizing data you have an option between a desktop dataviz tool and a cloud dataviz tool. We will explore one example of both.

Our recommended desktop software for visualizing complex data is Power BI. We are recommending it because of its compatibility with Excel and the fact that it’s free to use for datasets up to 1 GB. You can download it here.

Before we start with Power BI, you will need to know that analyzing data starts by asking questions and then using data to answer them. For example, you can ask questions regarding our practice data set before we even upload it to the dataviz tool:

  • What was the EDF funding per region?
  • Which group received the biggest funding?

Depending on the data set, you can ask a 1000 questions and, make no mistake, you will get a 1000 answers. OK, let’s move on to more serious stuff. Power BI.

Power BI

Power BI is a Business Intelligence tool created for monitoring business performance and discovering market opportunities. Today we will use it as a data journalism tool in order to answer the two questions above.

Once you open Power BI you first click on Get Data > Excel > Connect > Your file.

Choose a sheet where data is located and press Load. Alternatively, you can press Edit if you’d like to check your data set for mistakes once again.

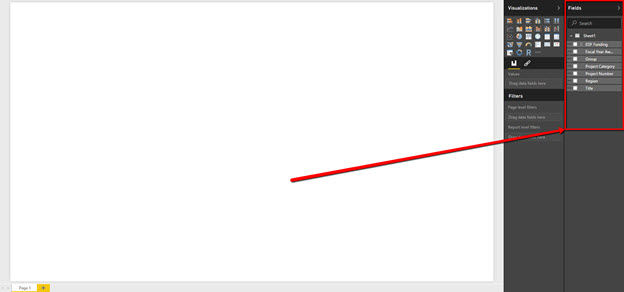
Once you do so, you will find a blank canvas and your data values on the right sidebar panel.

Accessing PowerBI Side Panel

These are the values we are going to slice and dice. Let’s try to answer our first question. If you remember, we wanted to know what was the EDF funding per region.

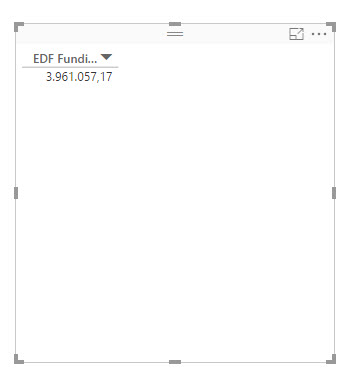
The basic data field there is EDF Funding so we’ll drag it into the “Values” box. The canvas immediately changes and it is now showing us the total EDF funding:

PowerBI EDF Funding Values

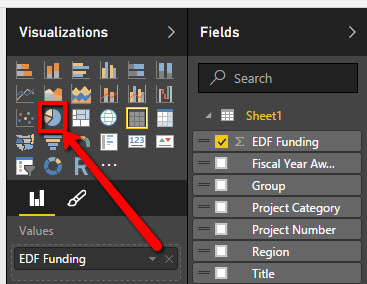
Let’s now introduce another data field. Select the “Pie chart”.

PowerBI Data Visualization Selection

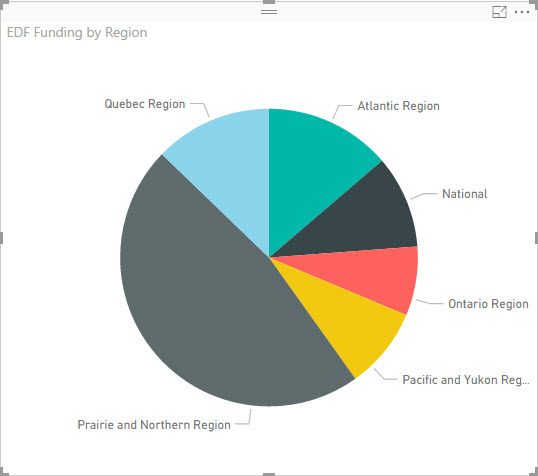
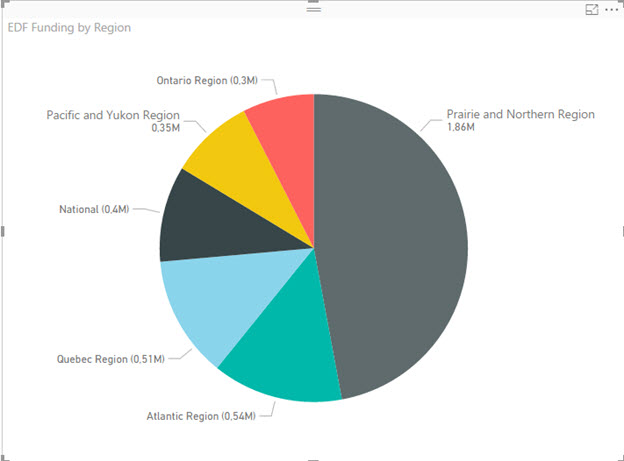
Drag the “Region” field into the “Legend” box. Congrats, you made your first data visualization! We now have an overview of the funding per region and we can already start answering some questions.

EDF Funding Visualization By Region

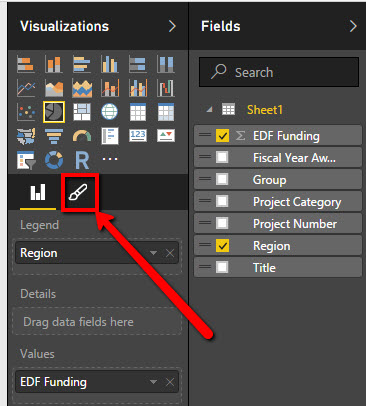
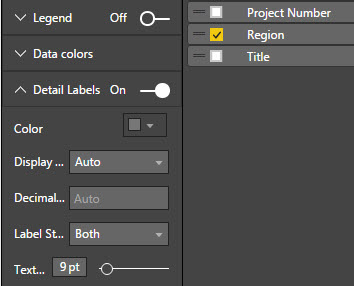
However, if you pay close attention you can see that we still don’t know the exact funding for each region. To show the exact values of data fields, go to “Format” panel:

Accessing PowerBI Fromat Panel

Expand the “Detail Labels” category, find the Label Style and select “Both” from the drop down menu.

Selecting PowerBI Detail Labels

Our pie chart is now showing us the specific monetary values for each segment. Great, first question answered.

EDF Funding Pie Chart

OK, next up is to see which Group received the biggest funding. We’ll repeat the process but we’ll use a different chart, just to demonstrate different features of Power BI.

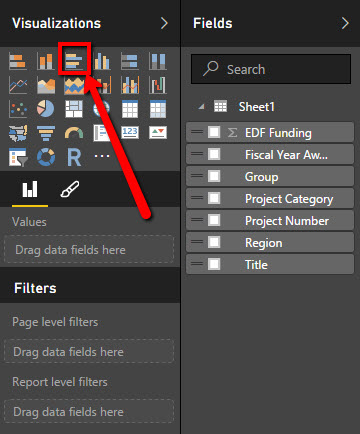
First, find and click on the Clustered Bar Chart.

Selecting Clustered Bar Chart

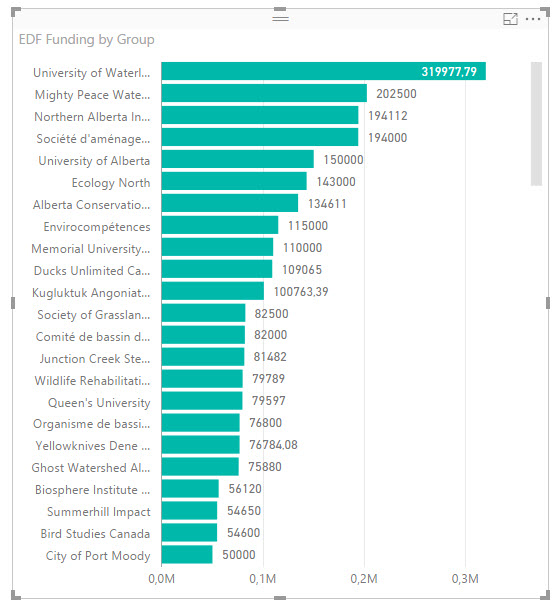
Drag the EDF Funding into the Values box and drag the Group into the Axis box. Turn on the data labels and you’ll quickly see that the University of Waterloo received the biggest funding — almost $320,000

EDF Group Values Chart

Now that you know how to ask questions and visualize public data, we will now quickly go over another tool that can help you visualize your data in the Cloud. Have in mind that the Cloud tools only support lower file sizes, which means you’re best off using them for 10-20 page data sets. Luckily, the data set from our example is actually pretty small.

DataHero

DataHero is a cloud solution for Business Intelligence and data visualization. It allows you to connect files from numerous online and offline sources and it even has an integrated data cleaning tool, which is nice, but I do not recommend relying solely on it.

You can use DataHero for free, for files up to 2 MB in size. Anything larger than that, and you’ll probably have to pay a monthly subscription which is between $60 and $90. For this purpose, we are going to use a free plan.

Create an account, click on the Data tab and click on Import Data.

Importing Data With DataHero

Find your Excel file, select the sheet and upload it:

Uploading Data with Datahero

On the next screen, check formatting and proceed.

What’s cool about DataHero is that it automatically suggests data visualizations:

Suggested Visualizations From DataHero

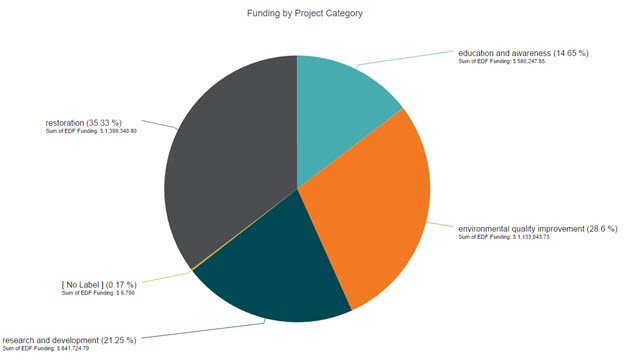
I was originally interested in EDF Funding by project category so I’ll just create a brand new chart. DataHero uses the same drag & drop interface so it’s really easy to start using it.

First, drag the EDF Funding field onto the canvas.

PowerBI EDF Funding Values

Next, drag & drop the Project Category field.

DataHero Pie Chart Visualization

As you can see, we received our answer. Most of the funding money (35%) went into Restoration projects and the rest  was dispersed equally between other three categories.

There are other, more complex, data visualization tools but we will stick with DataHero and Power BI for the time being as they offer the most features in their free plans.

Let’s recap the entire process of analyzing public data that’s archived in PDF:

  1. Find a relevant data set
  2. Use Able2Extract’s Custom PDF to Excel feature  to convert it to Excel or CSV
  3. Clean the data in Excel and remove blank rows and cells
  4. Visualize the data using a tool like Power BI or DataHero

By now you should have a clear understanding of the entire process of analyzing public data and should be well on your way to using it to shape the future of journalism. The strategy is simple — just upload clean, high quality data and play around with it until you get what you are looking for.

How To Create A Custom Keyboard Shortcut?

Part  10 of 13 in our How To Use AutoCAD series

Becoming a master in AutoCAD means that you should be able to incrementally improve your skills and thus, your productivity. Even though some things may be difficult to learn at first, eventually it’ll become second nature and  you’ll forget about tracking down the location of your favorite tools on the dashboard.

One of the things you can do to instantly increase your drafting speed is to create custom keyboard shortcuts for existing commands.  As part of our How to Use AutoCAD series, we’re here to show you how to go about creating them.

This is easily accomplished through AutoCAD’s Customize User Interface (CUI) feature.

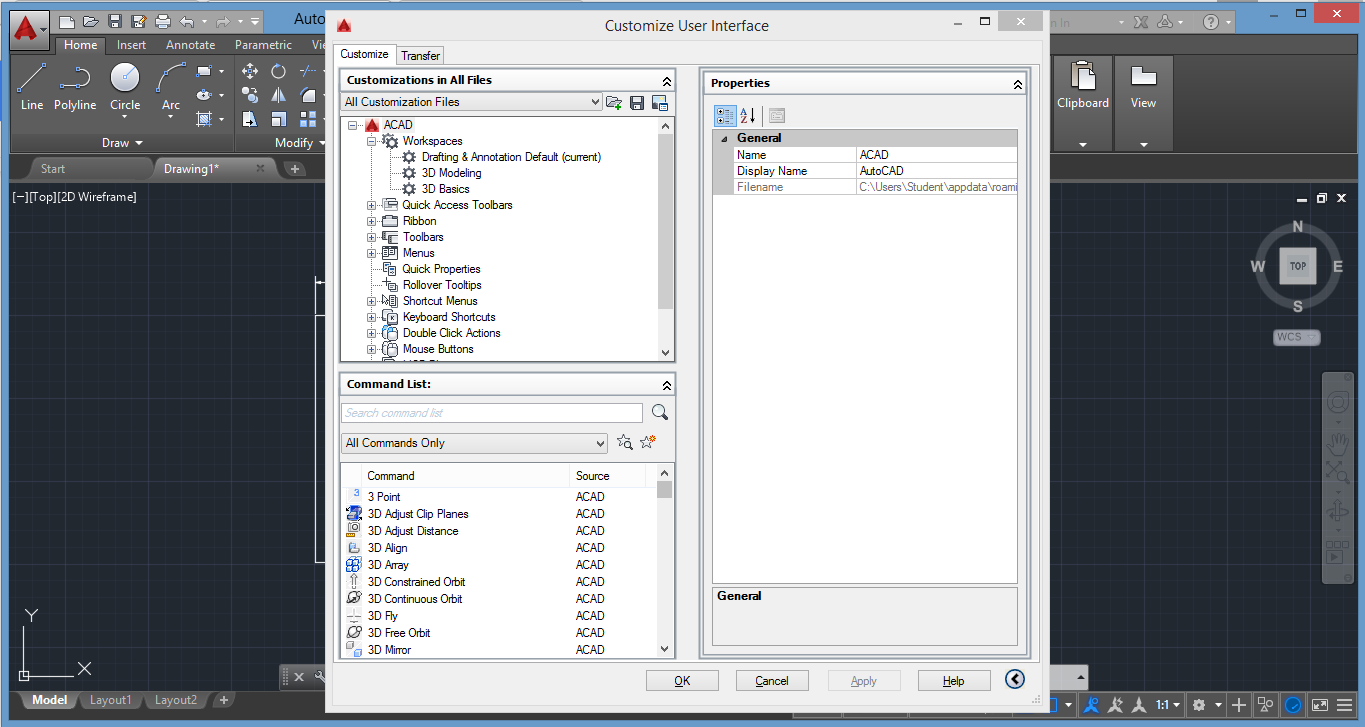
Customizing AutoCAD Interface

1. To access CUI, enter “cui” in the command line and press Enter. Alternatively, go to “Manage” tab, and under Customization panel click on the “User Interface” button.

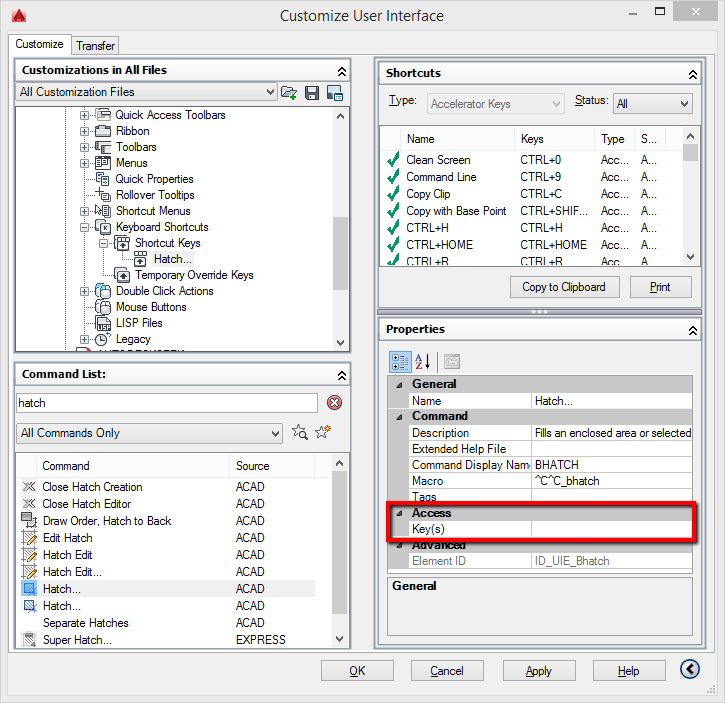
2. In the command list panel type the command that you would like to assign a keyboard shortcut to. For example, type in “Hatch”. Locate it on the menu below and left click to see its button image and properties.  As you can see from the properties panel on the left, there is no keyboard shortcut assigned to this command. We’re going to now enable a custom keyboard shortcut for this command.

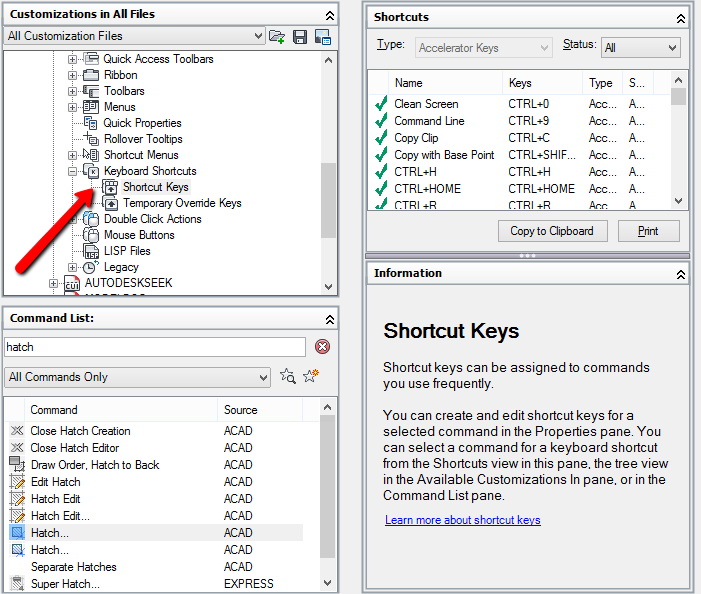
3. In the “Customization in All Files” panel, expand the last item in the list – Partial Customization Files. Now expand the list in the following order: “Custom” > “Keyboard Shortcuts” > “Shortcut Keys”.

AutoCAD Shortcut Keys

4. Click and drag the desired command from the “Command List’ menu to the “Shortcut Keys” folder above. You should see your command in the properties menu on the lower right side.

Assigning Custom AutoCAD Shortcuts

5. As you can see there is an “Access” command under which there is a “Key(s)” box. Click on it and then on the three dots  which will appear to the right. You can now specify your keyboard shortcut for this command. Hit “Apply” and then “OK”.

Besides assigning custom shortcuts to existing commands, you can even create your own custom commands and macros and assign them your favorite keyboard shortcuts. This tutorial further explains the process:  How to Create a Custom Command.